Introduction
Root Level Structure
While HDF5 gives great flexibility in data storage, straightforward file readability and exchange requires adhering to an agreed-upon naming and organizational convention. To achieve this goal, Data Exchange adopts a layered approach by defining a set of mandatory and optional fields.
The general structure of a Data Exchange file is shown in table [tab:genrules]. The most basic file must have an implements string, and an exchange group at the root level/group of the HDF5 file. Optional measurement and process groups are also defined. Beyond this, additional groups may be added to meet individual needs, with guidelines suggesting the best structure.
| Member | Type | Example |
|---|---|---|
| implements | string dataset | exchange:measurement:process |
| exchange | group | |
| measurement | group | |
| process | group |
- implements
- Mandatory scalar string dataset in the root of the HDF5 file whose value is a colon separated list that shows which components are present in the file. All components listed in the implements string are to be groups placed in the HDF5 file at the root level/group. In a minimal Data Exchange file, the only mandatory item in this list is exchange. A more general Data Exchange file also contain measurement and possibly process, in which case the implements string would be: exchange:measurement:process.
- exchange
- Mandatory group containing one or more arrays that represent the most basic version of the data, such as raw or normalized optical density maps or a elemental signal map. Exchange_N is used when more than one core dataset or derived datasets are saved in the file. The exchange implementation for specific techniques are defined in separate sections in the Reference Guide.
- measurement
- Optional group containing the measurement made on the sample; measurement contains information about the sample and the instrument; measurement_N is used when more than one measurement is stored in the same file.
- process
- The Process group describes all the “work” that has been done. This includes data processing steps that have been applied to the data as well as experimental steps (e.g. data collection strategy etc.) and sample preparation ahead of the experiment and during the measurement (e.g. environment conditions etc.).
In a Data Exchange file, each dataset has a unit defined using the units attribute. units is not mandatory - if omitted, the default unit as defined in Appendix [appendix:units] is used.
The detailed rules about how to store datasets within the exchange group are best shown through examples in the next section. Detailed reference information can be found in the section.
Definitions
Color code
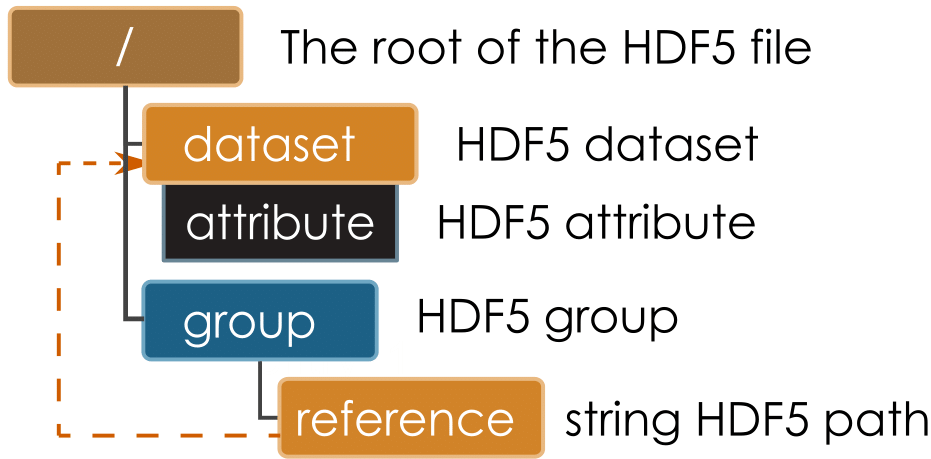
All the diagrams in this section follow the color conventions shown in Color Code. The basic elements are HDF5 datasets, attributes, and groups. We also support internal references to elements in the file by a simple scalar string that holds the path of the dataset within the file. On the diagram, this is shown as a reference dataset that points to the referred-to dataset. Note that we use this mechanism rather than HDF5 hard or soft links
Color Code
Multidimensional data
A multidimensional dataset should be described as fully as possible, with units for the dataset as well as dimension descriptors (that also have units defined). There are also additional descriptive fields available such as title and description. The order of dimensions in the dataset should put the slowest changing dimension first, and the fastest changing dimension last.
It is strongly encouraged that all datasets have a units attribute. The string value for units should preferably be an SI unit, however well understood non-SI units are acceptable, in particular degrees. The units strings should conform to those defined by UDUNITS [B2]. While UDUNITS is a software package, it contains simple XML files that describe units strings and acceptable aliases.
The axes of a multidimensional dataset are described through the use of additional one-dimensional datasets (dimension descriptors), one for each axis in the main dataset. Take for example a 3-dimensional cube of images, with axes of x, y, and z where z represents the angle of the sample when each image was taken. There should be 3 additional one-dimensional datasets called x, y, and z where x and y contain an integer sequence, and z contains a list of angles. X and y have units of counts and z has units of degree. To simplify, it is acceptable to omit x and y, since the default interpretation will always be an integer sequence.
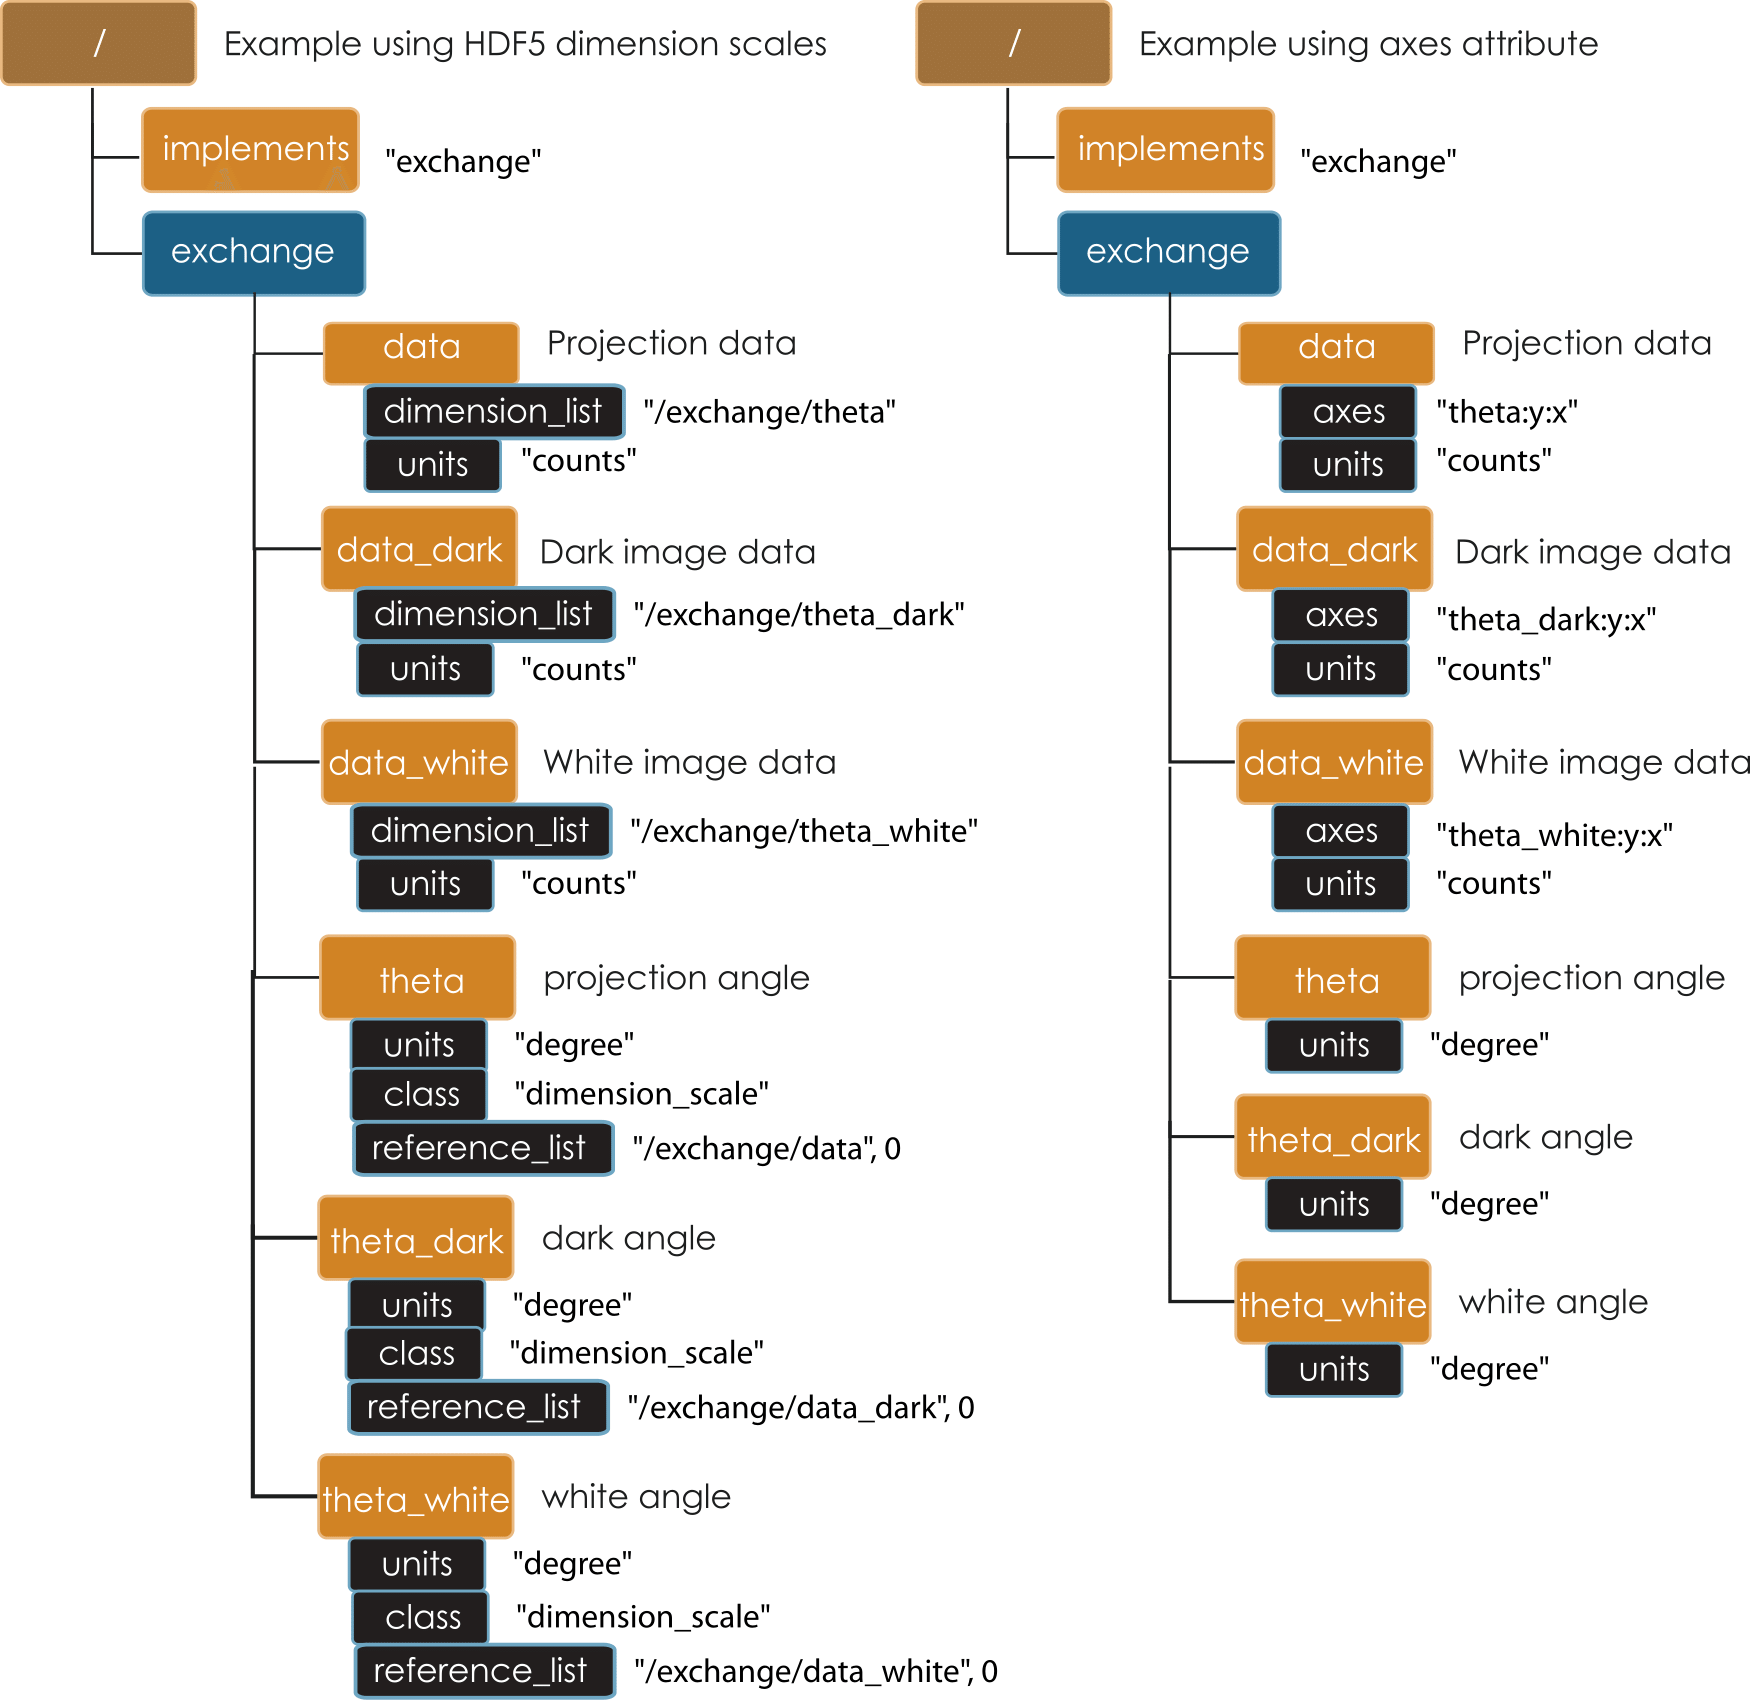
The dimension descriptors (x, y, z) can be associated with the main dataset through two mechanisms. The HDF5 libraries contain a function call H5DSattach_scale to attach a dimension descriptor dataset to a given dimension of the main dataset. HDF5 takes care of entering several attributes in the file that serve to keep track of this association. If the particular programming language you work in does not support this HDF5 function, then you can instead add a string attribute to your main dataset called axes. The axes attribute is simply a colon separated string naming the dimension descriptor datasets in order, so z:y:x in this case. Additional examples below show this in action.
Data Structure
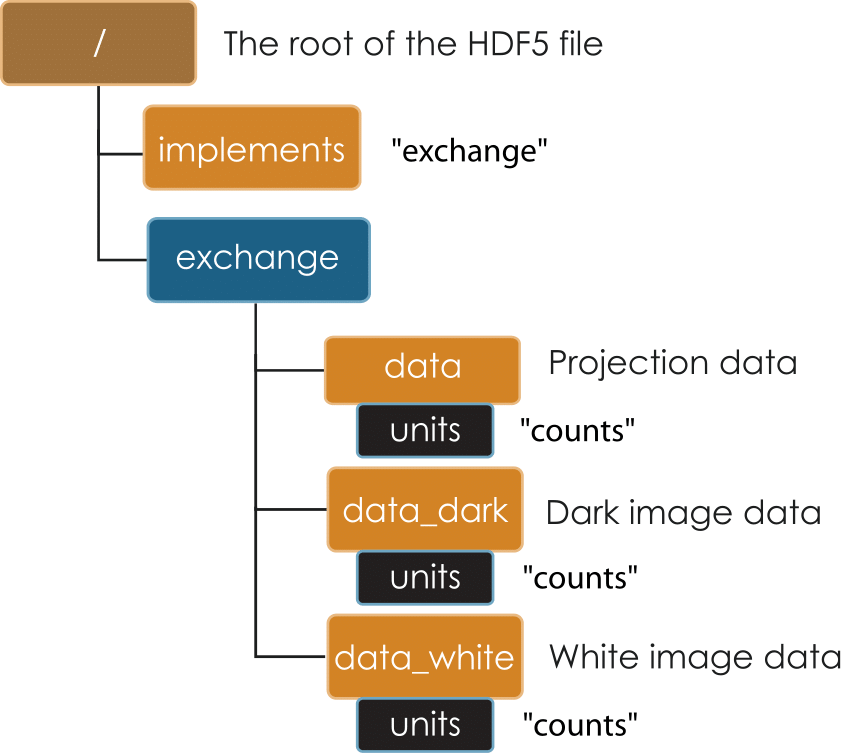
A tomographic data set consists of a series of projections, dark and white field images. The dark and white fields must have the same projection image dimensions and can be collected at any time before, after or during the projection data collection. The angular position of the tomographic rotation axis, theta, can be used to keep track of when the dark and white images are collected. These examples show projection, dark, and white images saved in three 3D arrays as shown in Basic Tomo A and Basic Tomo B using, by default, the natural HDF5 order of the a multidimensional array (rotation axis, ccd y, ccd x), i.e. with the fastest changing dimension being the last dimension, and the slowest changing dimension being the first dimension. If using the default dimension order, the axes attribute theta:y:x can be omitted. The attribute is mandatory if the 3D arrays use a different axes order. This could be the case when, for example, the arrays are optimized for sinogram read y:theta:x. As no units are specified the data is assumed to be in *counts” with the axes (x, y) in pixels. If the positions of the rotation axis for each projection, dark, and white images are not specified via theta dimension scale datasets, it is assumed that the raw projections are taken at equally spaced angular intervals between 0 and 180 degree, with white and dark field collected at the same time before or after the projection data collection.
Basic Tomo A
Basic Tomo B
Imaging
The examples in this section show how one can store data for imaging experiments using the Data Exchange format. It is general enough, however, to show how Data Exchange can be extended or adapted to other techniques. These examples are meant to give a flavor for our approach. A complete reference to the core structure can be found in Section Reference. Technique specific extensions to the core structure can be found at the end of the Reference Guide.
Minimal DXfile shows a diagram of a minimal Data Exchange file to store a single projection image. It is strongly encouraged that all datasets shall have a units attribute. The axes of the dataset are not specified in this minimal case, and can be assumed to be x and y with a zero-based integer sequence, or more simply, pixels.
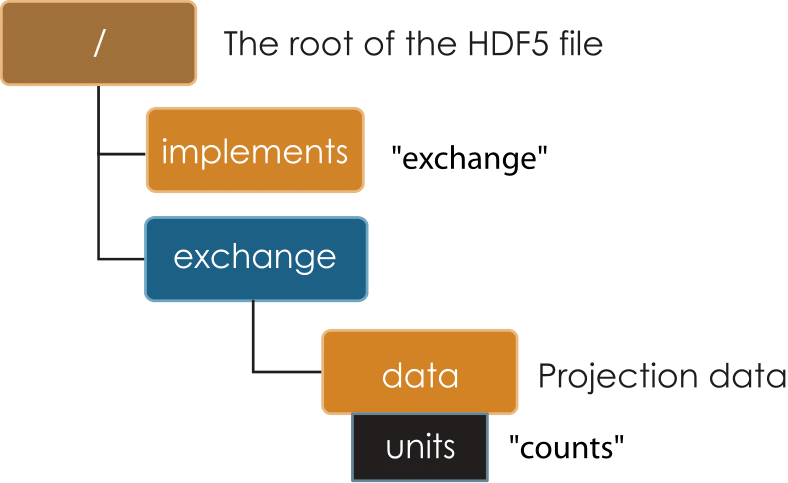
Minimal DXfile
Series
A series of tomographic measurements, when relevant, can be stored in the same file appending _N to the measurement tag. A series of tomographic data sets are typically collected changing the instrument status (energy, detector or optics position); changing the sample status (position, environment etc.). Figure Temperature, Energy and Distance show the content of files changing the sample temperature, the X-ray source energy and detector-sample distance. In nano tomography experiments, for example, the detector field of view is often smaller than the sample. To collect a complete tomographic data set, it is necessary to raster the sample across the field of view moving its x and y location. Figure Raster shows a file from a nano tomography experiment when the sample rasters through the field of view.
There are limits to this approach, as one clearly does not want to have hundreds of measurement groups in a file (or multiple files) where most of the metadata is the same. For measurements where there are many “positioner” values (aka a “scan”), it is more sensible to add dimension(s) to the exchange dataset, and describe the “positioner” values as dimension scales. This is a judgement left to the user.
Temperature
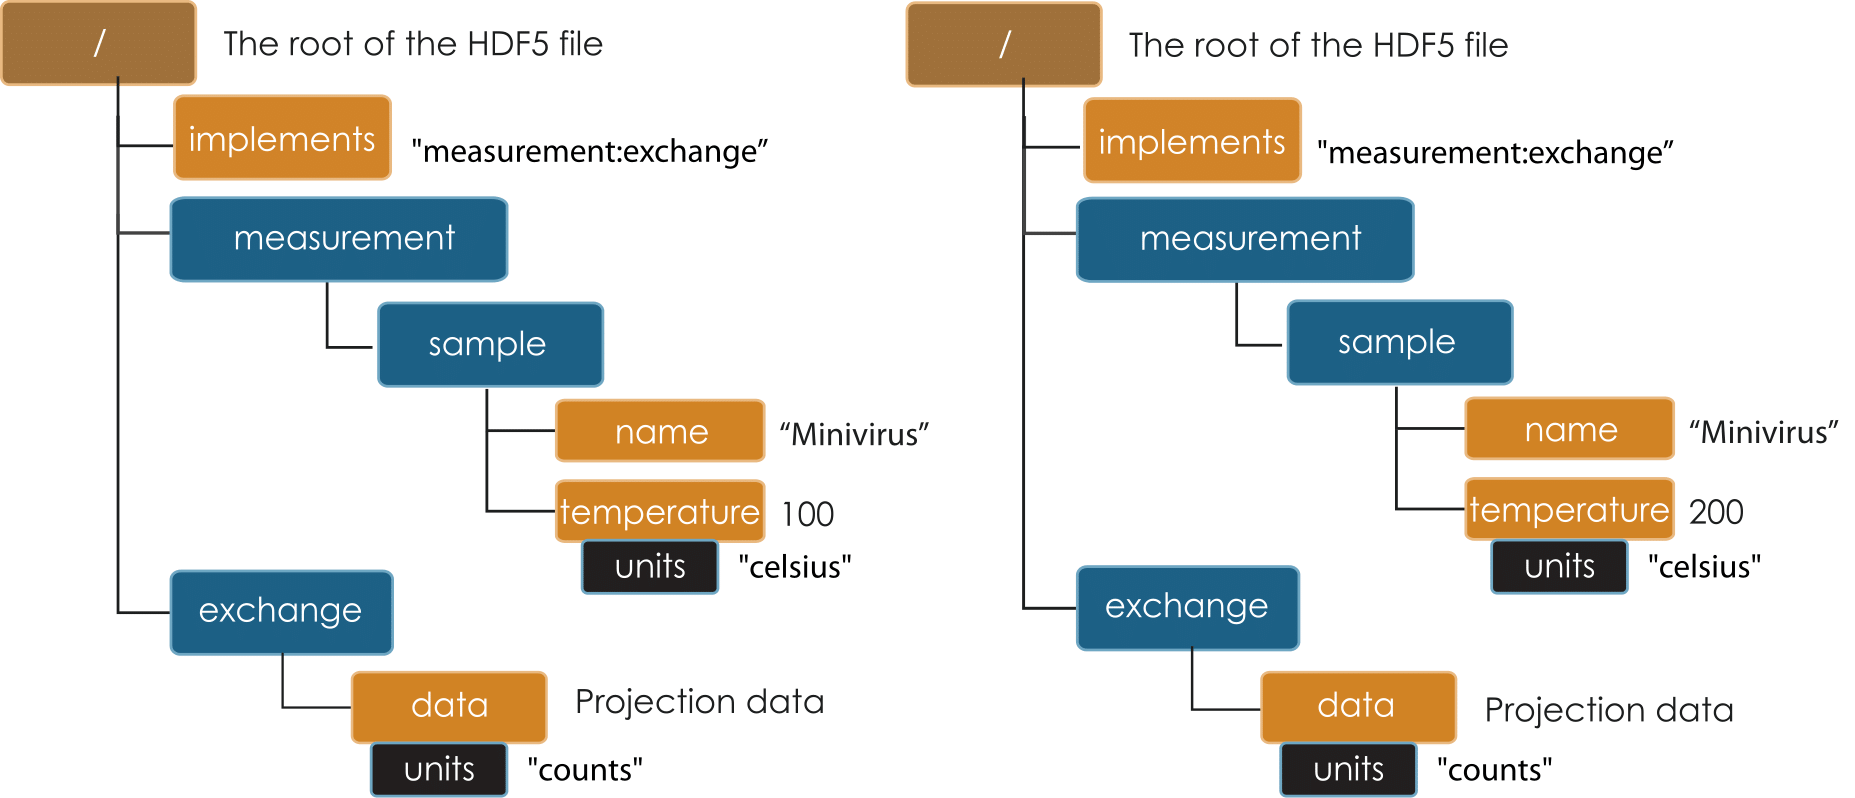
Temperature
Energy
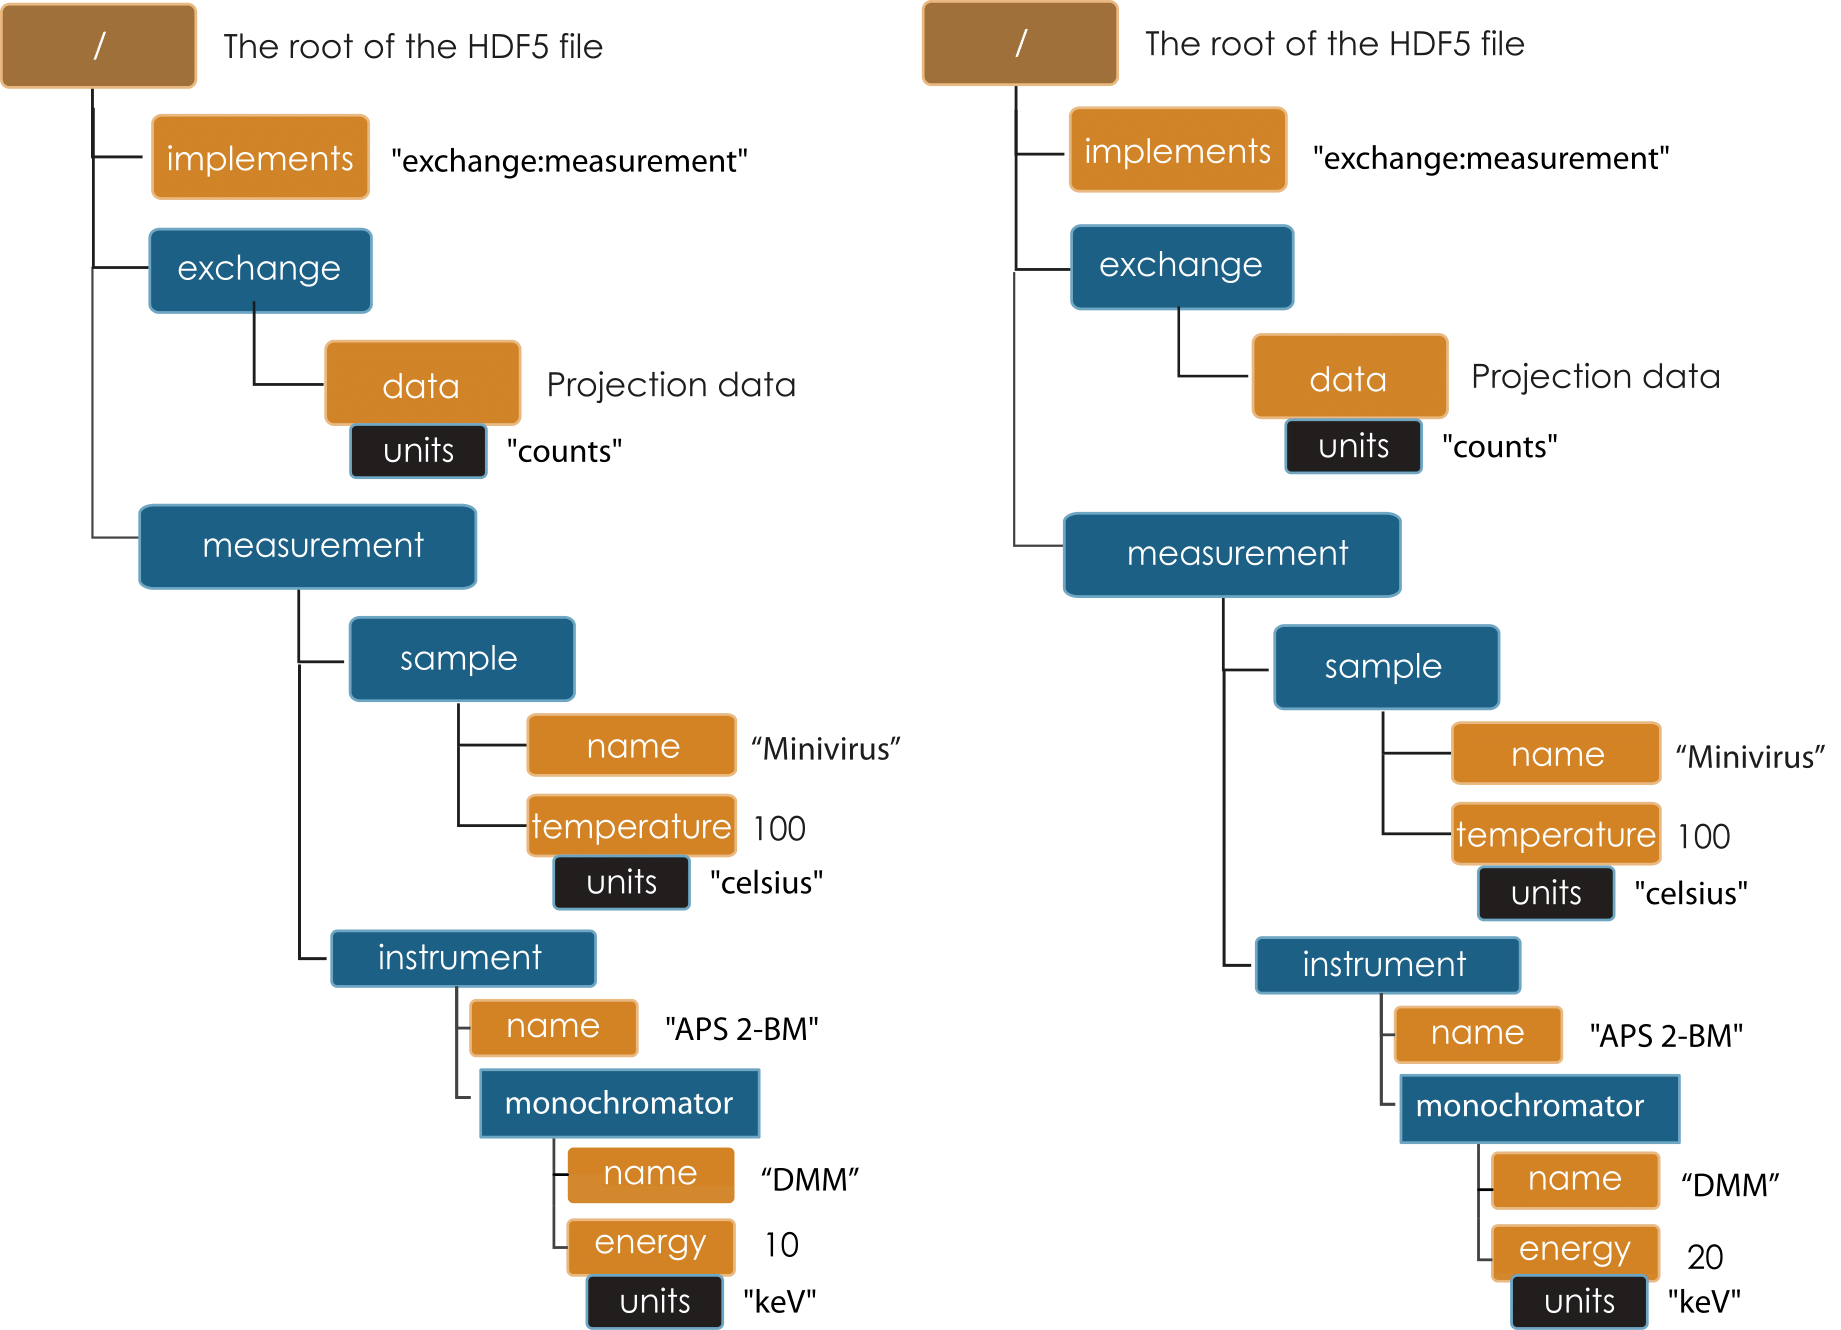
Energy
Detector-sample distance
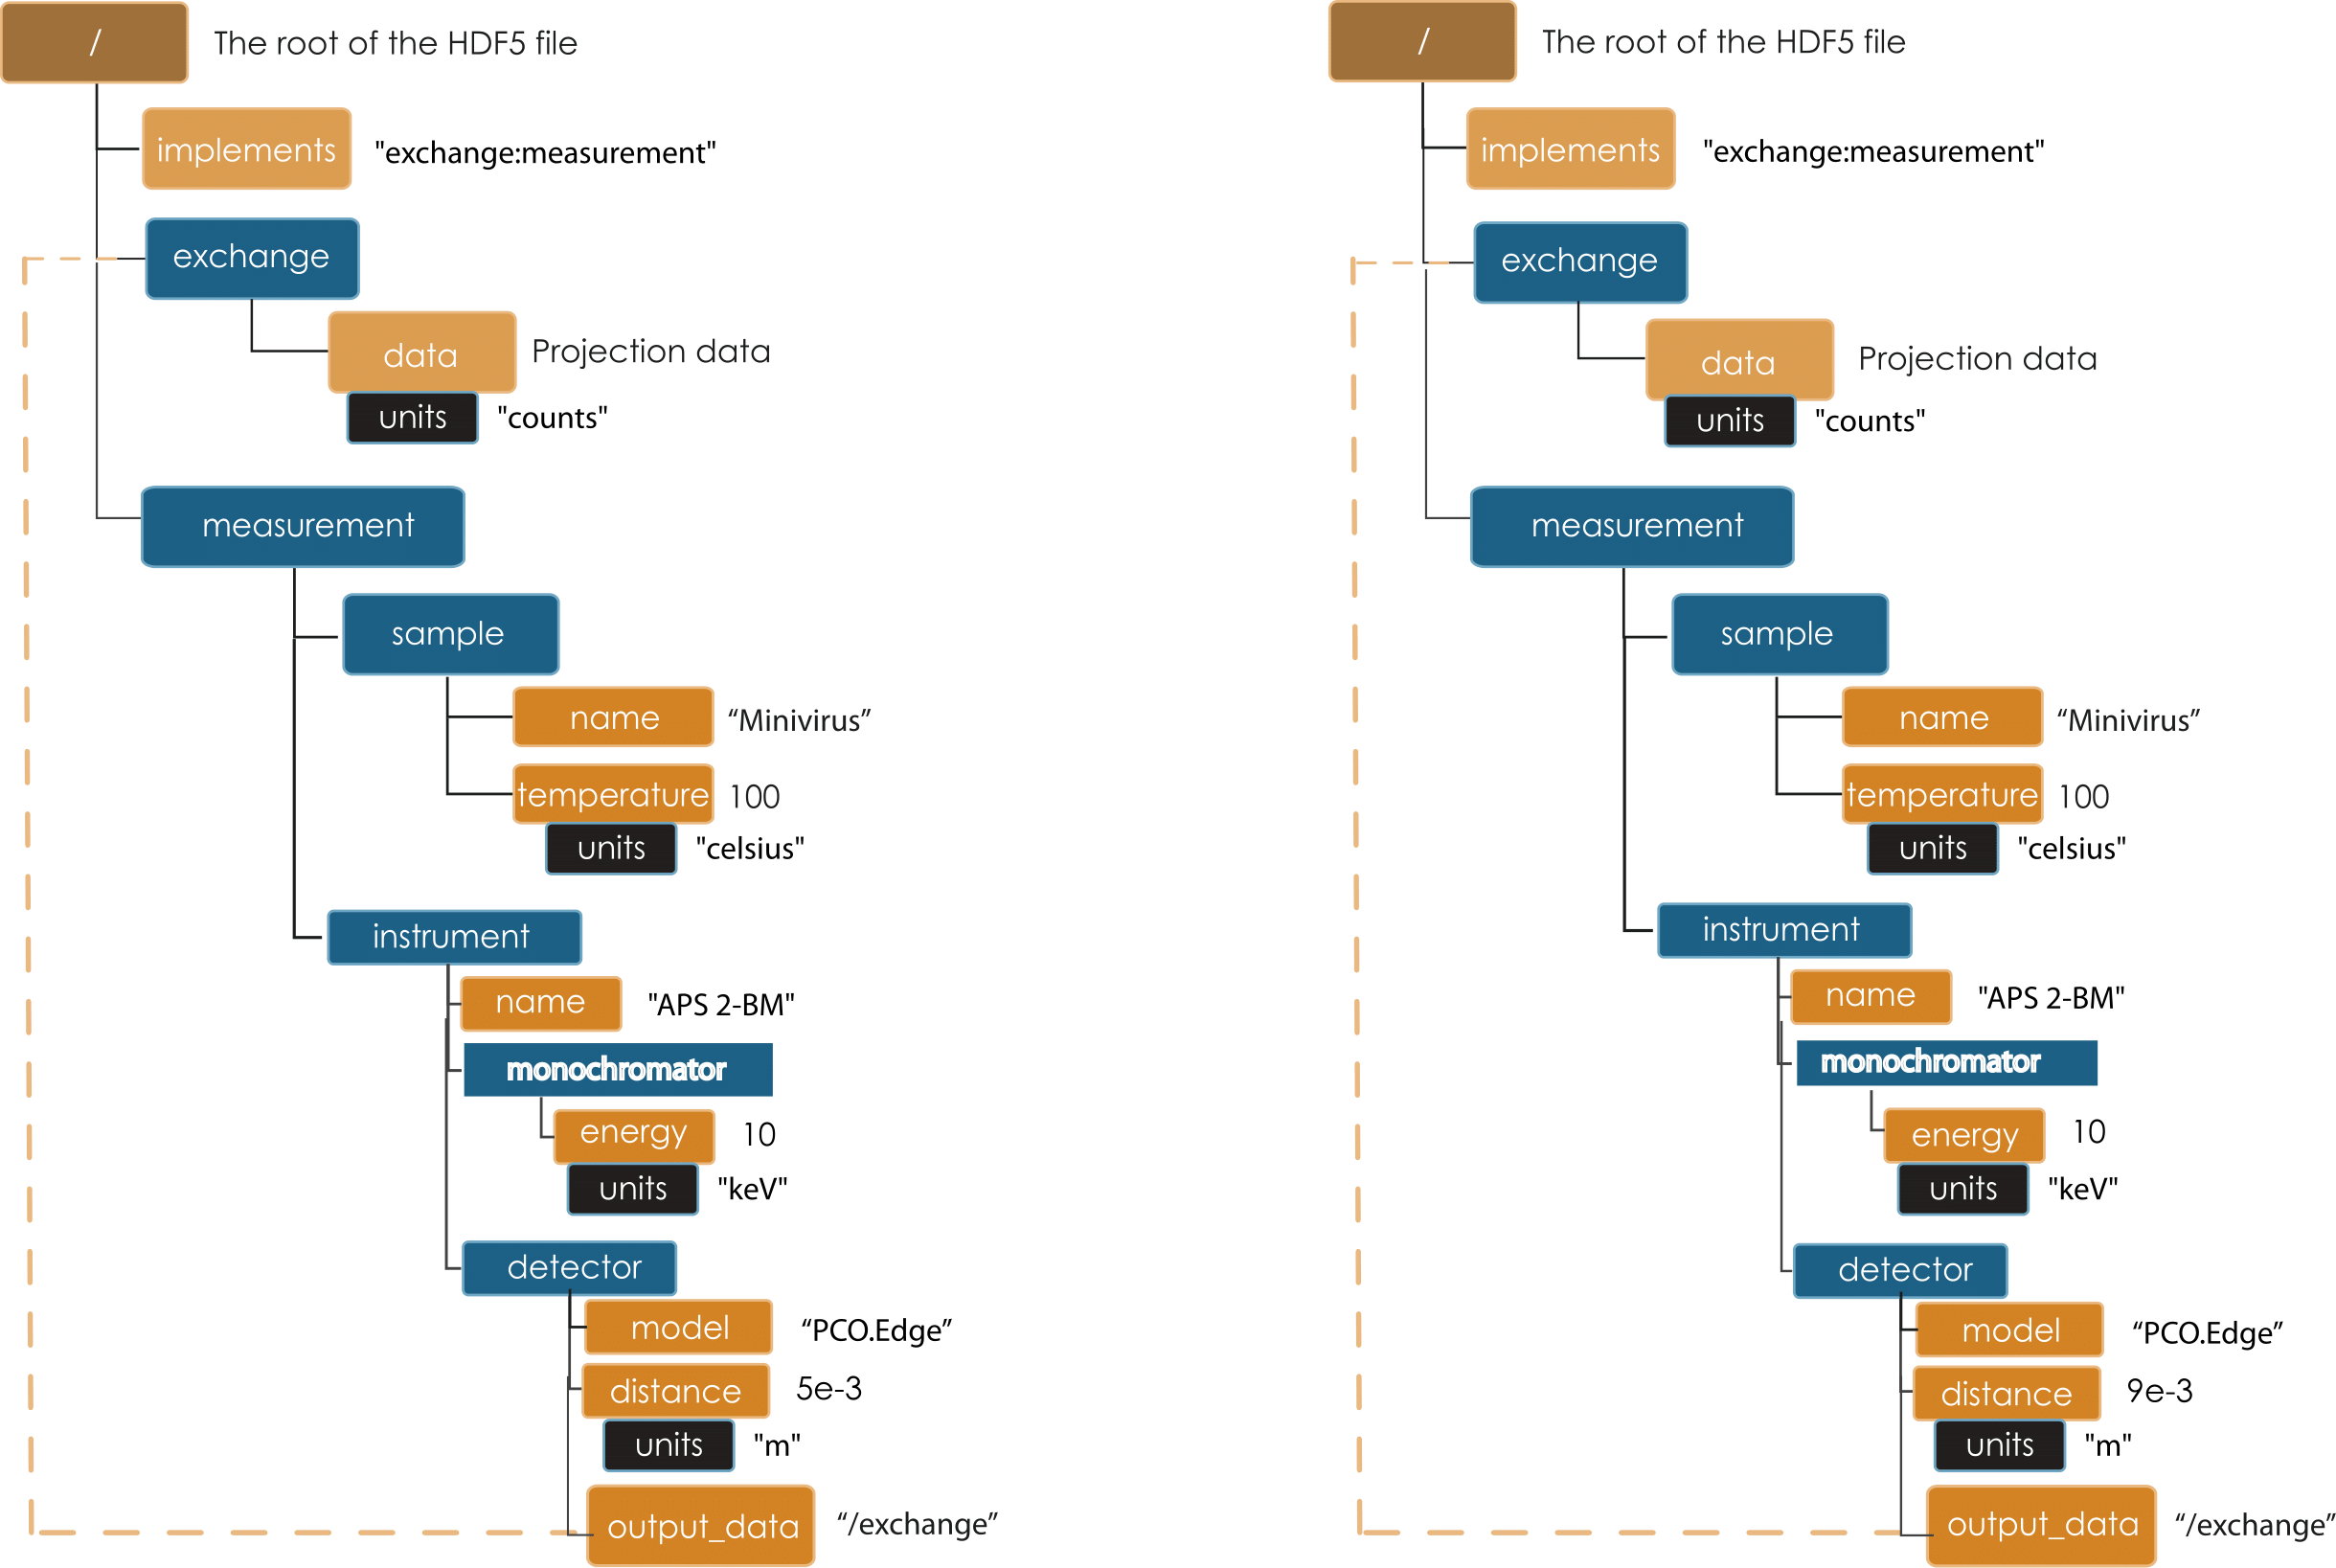
Distance
Raster
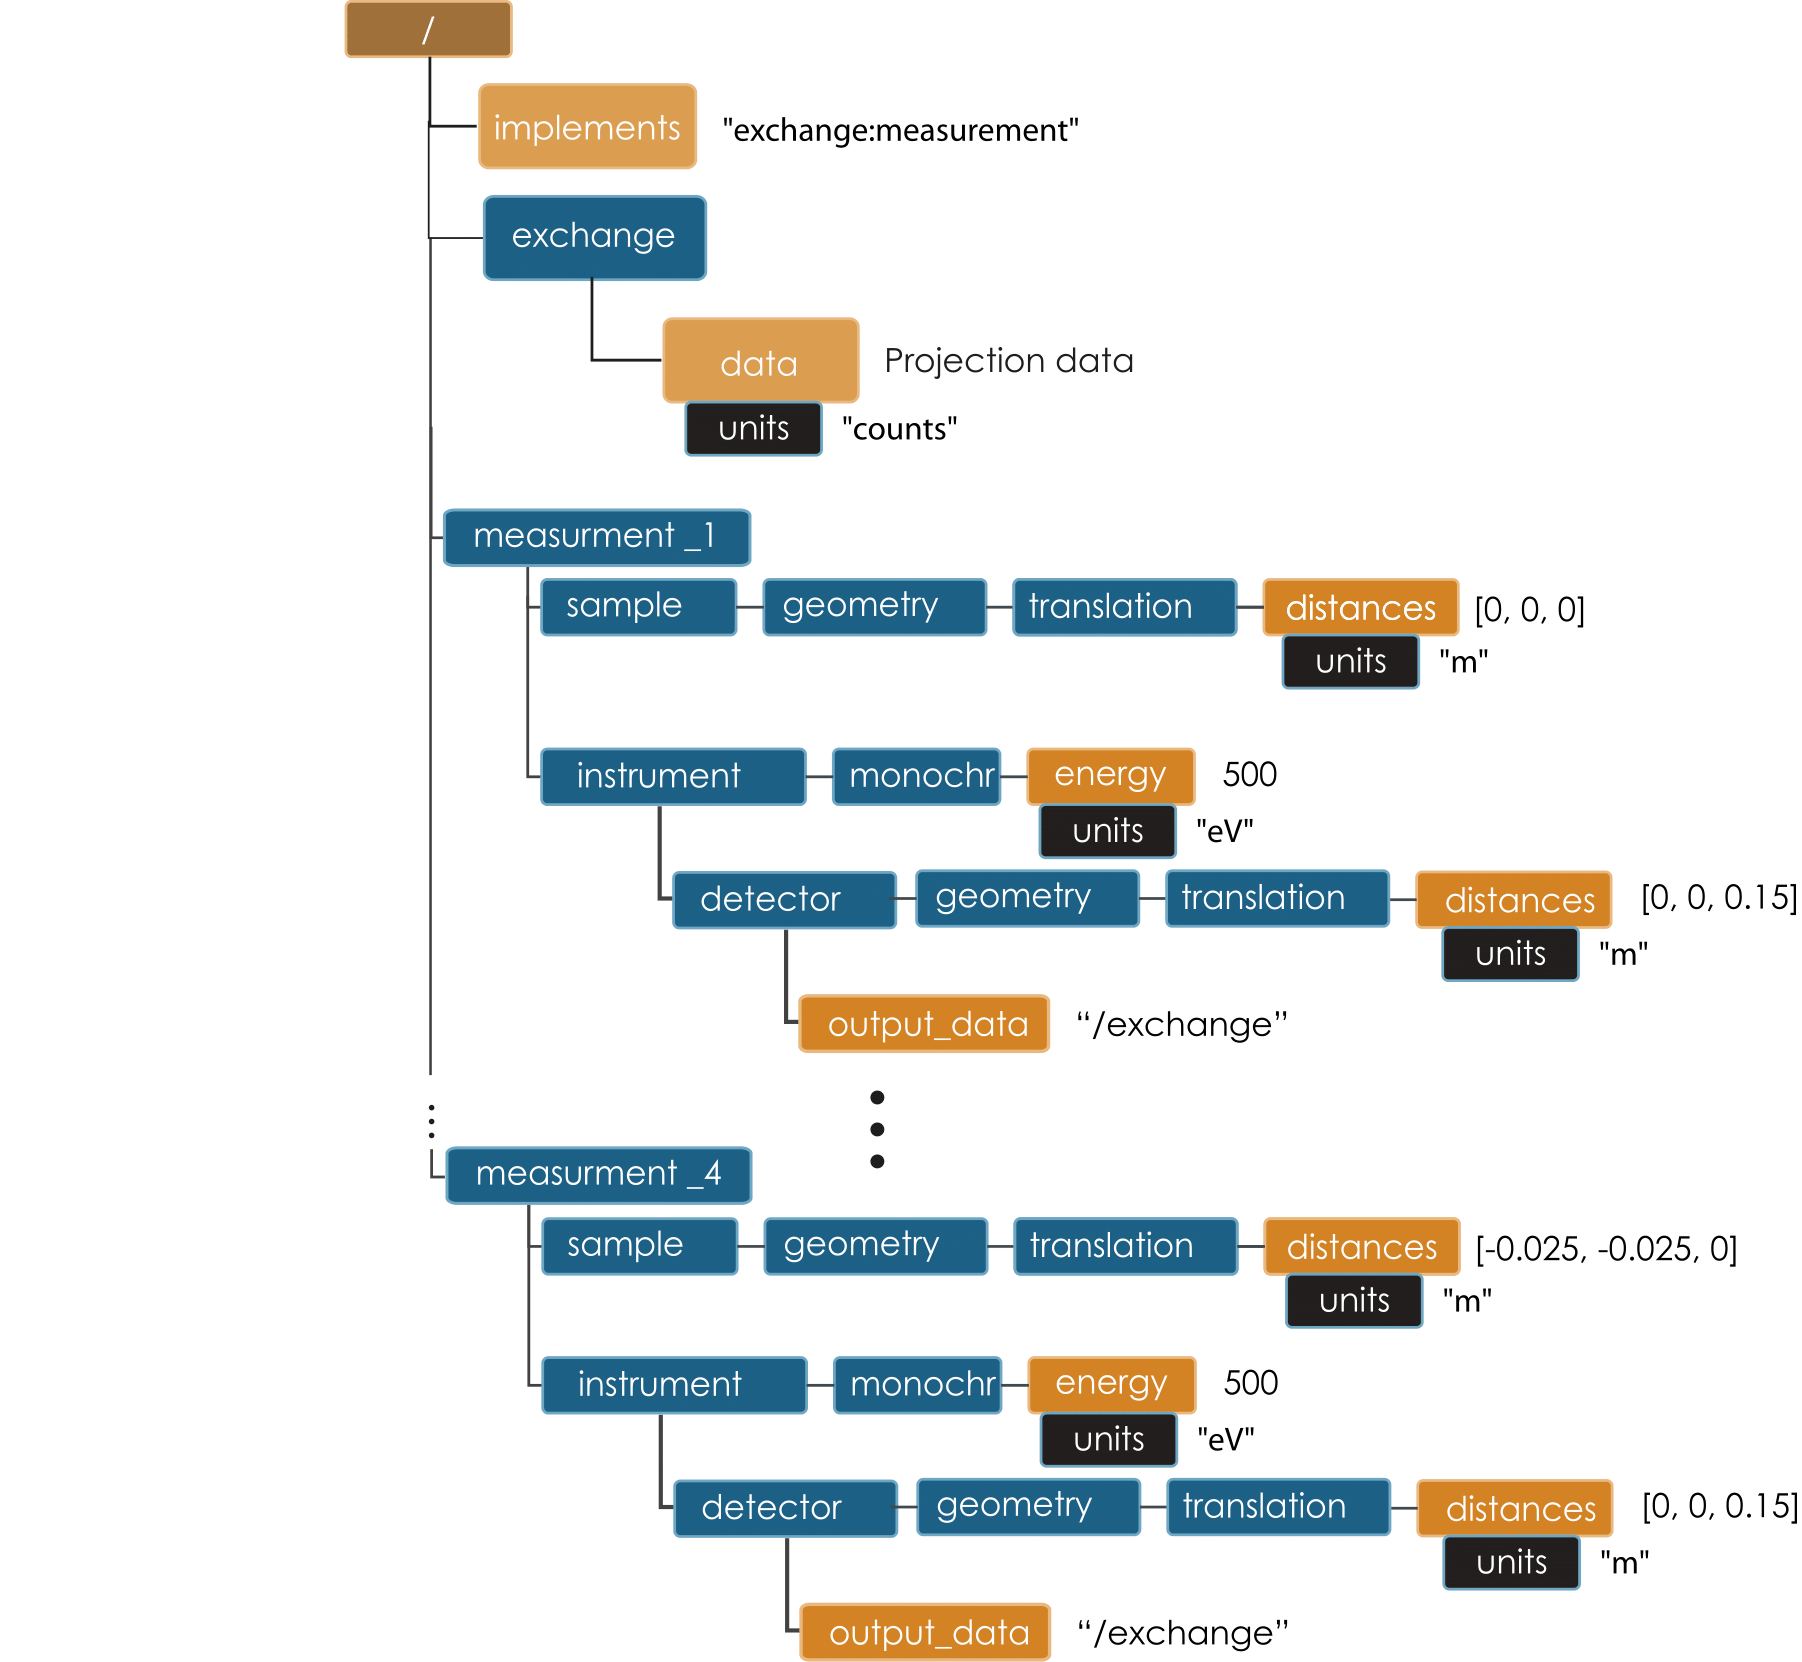
Raster